Every year, businesses lose billions of dollars to an entirely preventable problem. A 2020 IHL Group study estimated that inventory distortion a direct result of poor demand forecasting, costs retailers alone over $1.77 trillion globally in lost sales and excess stock. For Indian supply chain operators, the cost is not just financial: it is the customer who switches brands after a single stockout, the warehouse overflowing with unsold seasonal inventory, the truck running half-empty on a lane that could have been optimized weeks in advance.
Demand forecasting is the analytical backbone that prevents this. Whether you are managing a network of distribution centres across South India or planning SKU-level replenishment for a fast-growing e-commerce brand, accurate demand forecasting in supply chain operations is the difference between reactive scrambling and proactive precision.
This guide covers everything you need: what demand forecasting is, the seven core methods, types, KPIs including MAPE, AI-powered techniques, and how it applies specifically to logistics, 3PL, warehousing, and e-commerce in India.
Know More About: 6 Benefits of Demand Forecasting
What Is Demand Forecasting?
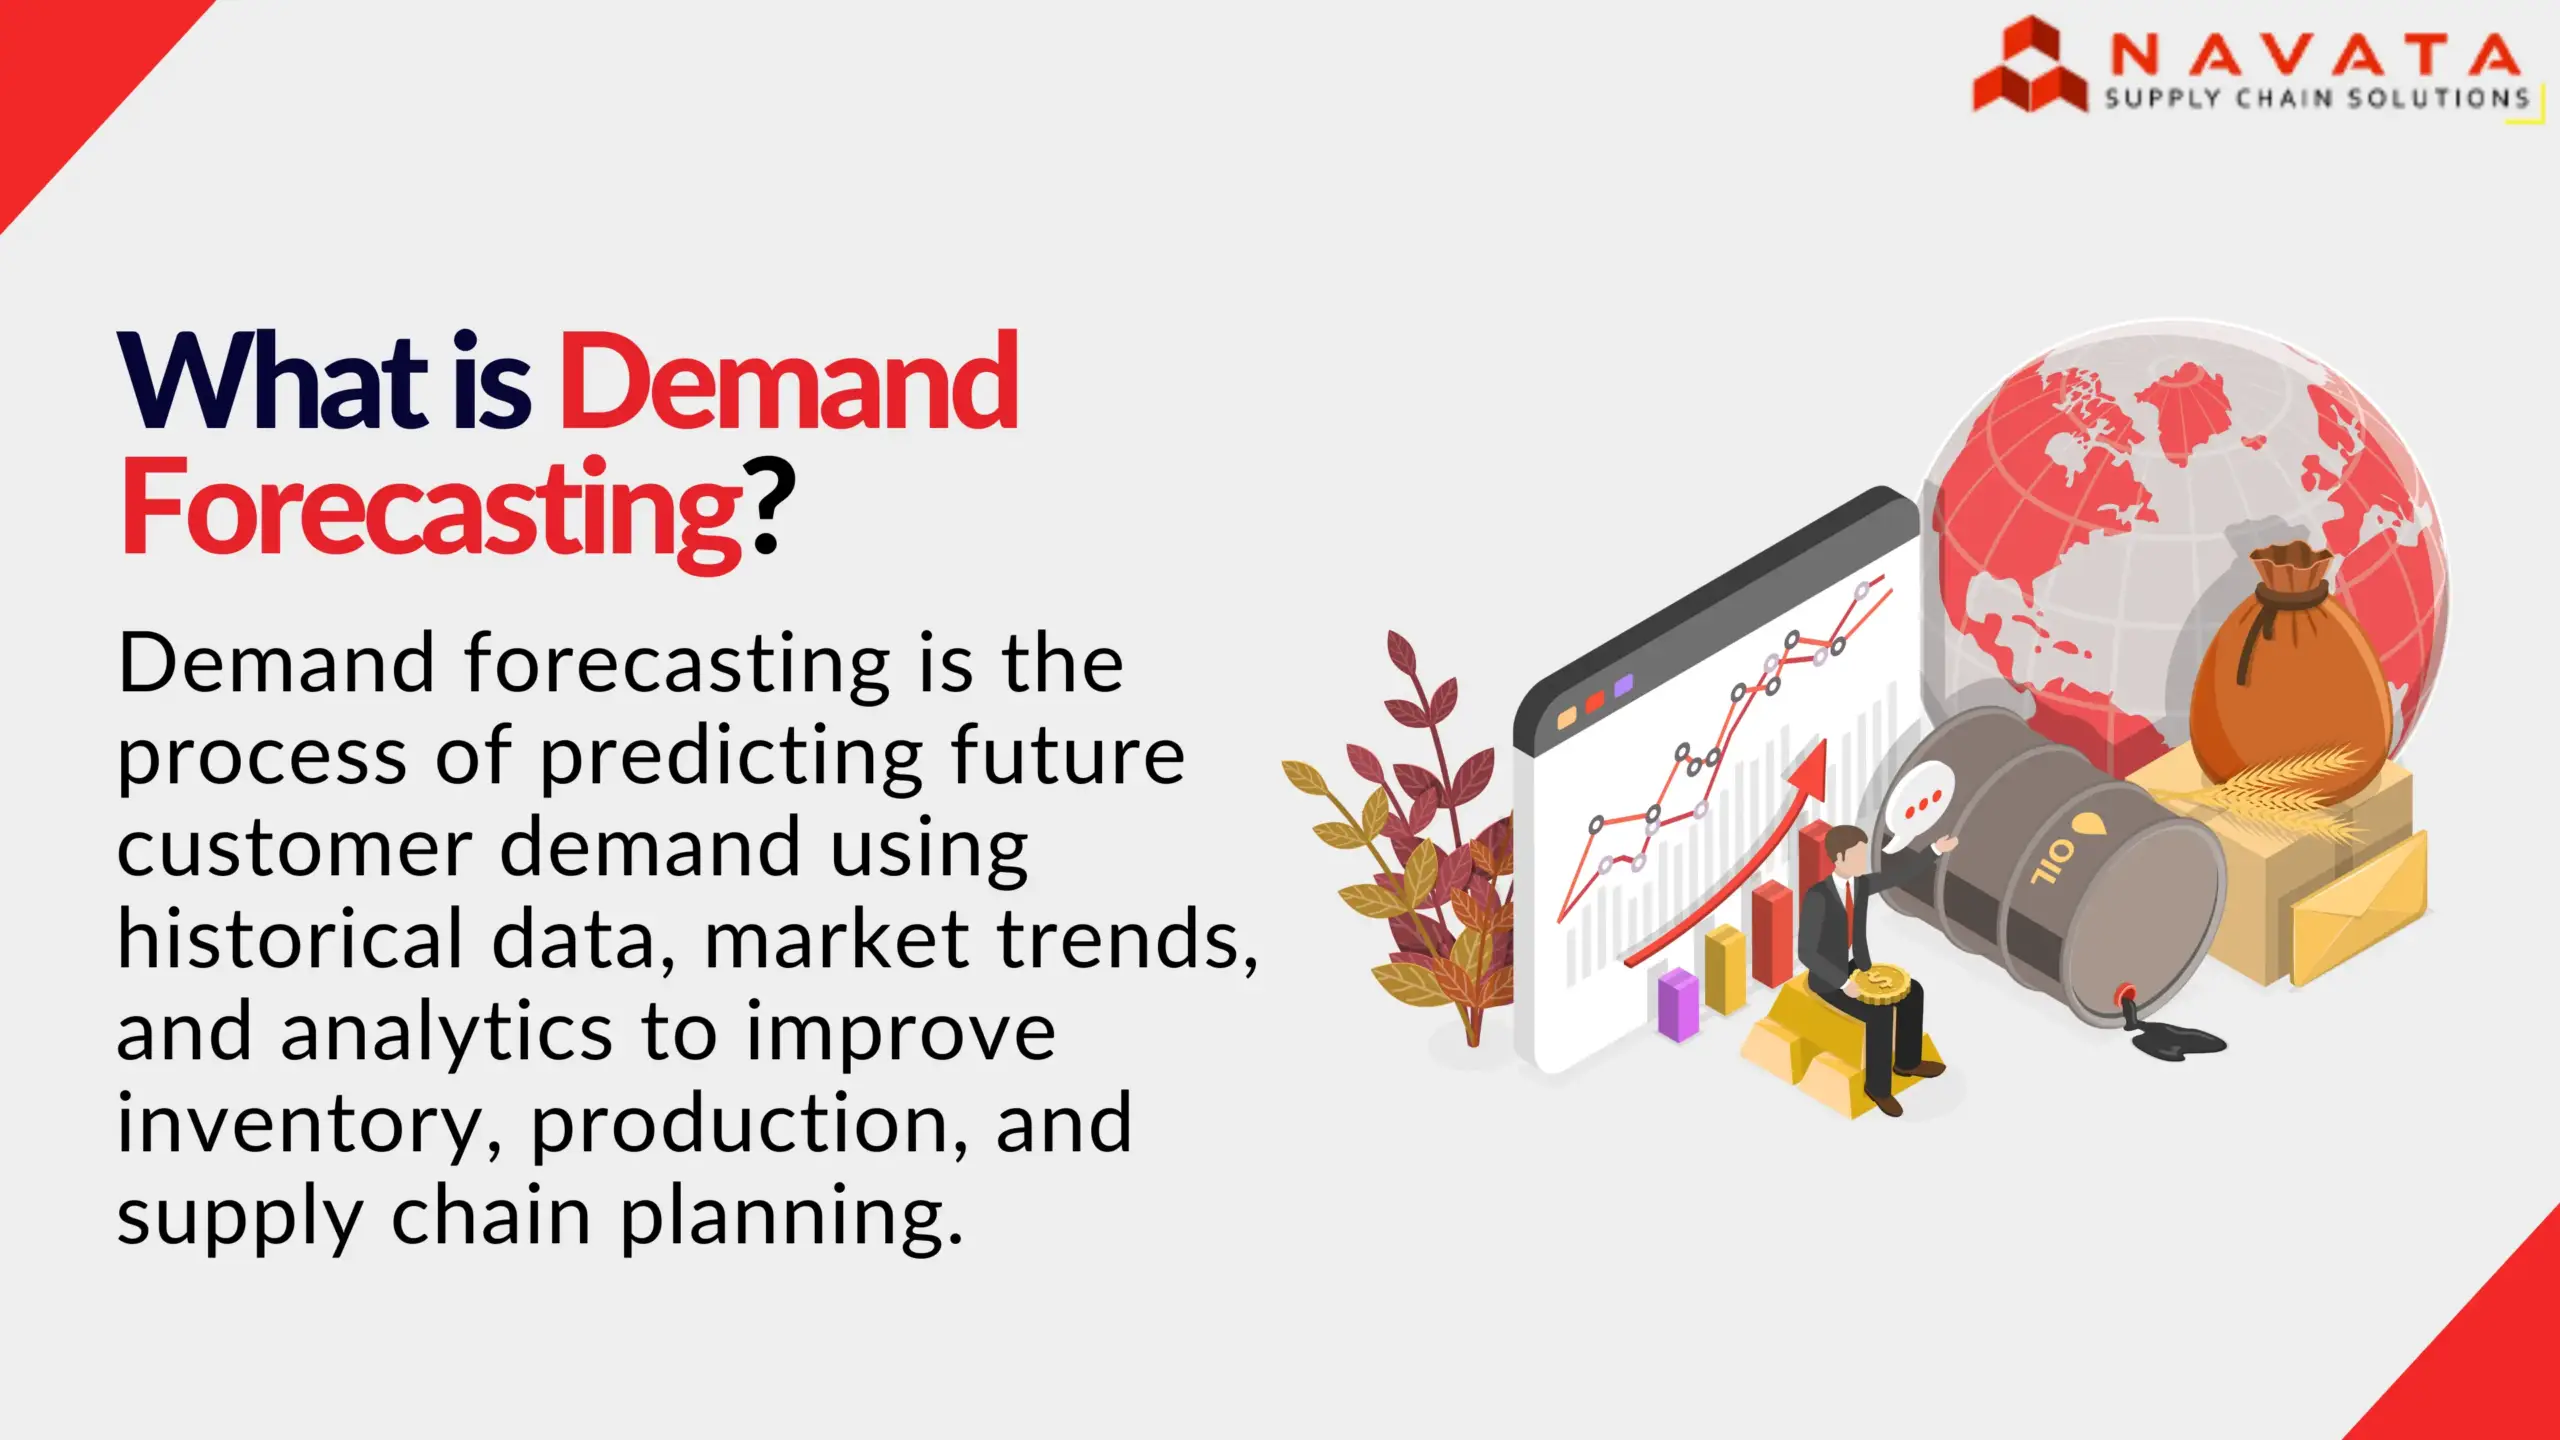
Demand forecasting is the analytical process of estimating future customer demand for products or services over a defined time period. It uses historical sales data, statistical models, and market signals to predict how much inventory a business needs, helping companies reduce stockouts, cut overstock costs, and optimize supply chain operations.
At its core, demand forecasting answers one critical question: How much of what product will be needed, where, and when? The answer drives every downstream supply chain decision from how much raw material to procure, how much warehouse space to allocate, how many trucks to schedule, and how to balance inventory across a distribution network.
Modern demand forecasting has evolved far beyond spreadsheet-based trend extrapolation. Today, it integrates qualitative judgment from sales teams, quantitative statistical modelling from historical data, and increasingly, AI and machine learning systems that process hundreds of variables simultaneously to generate granular, SKU-level predictions in near real-time.
For supply chain operators in India, where demand patterns are shaped by festivals, monsoons, regional diversity, and the rapid growth of e-commerce, demand forecasting is not a back-office function. It is a strategic capability.
Demand Forecasting vs Demand Planning
Demand forecasting and demand planning are closely related but serve distinct purposes. Demand forecasting predicts future customer demand using data and statistical models it answers “how much will be needed?” Demand planning converts those predictions into actionable supply chain strategies, covering procurement, production scheduling, and inventory decisions. Forecasting provides the intelligence; demand planning provides the execution roadmap.
Think of it this way: demand forecasting is the weather report; demand planning is deciding what to wear, whether to carry an umbrella, and whether to reschedule the outdoor event.
| Dimension | Demand Forecasting | Demand Planning |
|---|---|---|
| Purpose | Predict future demand | Act on the forecast |
| Output | Demand estimate (numbers) | Procurement/production plan |
| Time horizon | Any (short to long) | Short-to-medium term |
| Who owns it | Data/analytics team | Supply chain/operations |
| Key input | Historical data, market signals | Forecast output + capacity data |
| Key metric | MAPE, forecast accuracy | Service level, inventory turns |
Both functions must work in tandem for effective supply chain management. Without accurate forecasting, demand planning is built on guesswork. Without structured planning, even the most accurate forecast fails to generate operational value.
Why Demand Forecasting Matters in Supply Chain
Demand forecasting in the supply chain is not optional for competitive businesses it is foundational. Poor forecasting leads directly to stockouts that cost sales and erode customer loyalty, overstock that ties up working capital and drives up carrying costs, inefficient production scheduling, unnecessary freight spend, and warehouse under-utilization or overflow.
Here are the six primary reasons why demand forecasting matters:
1. Inventory Optimization
Accurate demand forecasts enable businesses to maintain the right inventory levels at the right locations at the right time. Companies using AI-assisted demand forecasting have reduced excess inventory by 15-20% (Capgemini Research, 2022), while simultaneously decreasing stockout events by 12-18%. For a company with ₹50 crore in annual inventory, a 15% reduction in excess stock represents ₹7.5 crore freed from working capital.
2. Cost Reduction
Inventory carrying costs, storage, handling, insurance, and obsolescence typically run between 20-30% of inventory value annually. Demand forecasting minimizes unnecessary stock accumulation, reduces emergency replenishment freight costs, and eliminates the margin erosion caused by markdowns on excess inventory.
3. Improved Customer Satisfaction and Service Levels
Stockouts are not just missed sales; they are brand-trust events. A customer who cannot find your product on the shelf or the app does not wait; they switch. Reliable demand forecasting maintains product availability, protects fill rates, and supports the service-level agreements that define 3PL and e-commerce delivery promises.
4. Efficient Production and Resource Planning
Manufacturers who forecast accurately can plan production runs optimally, minimize changeovers, reduce raw material waste, and staff warehouses and production lines appropriately. Effective inventory management begins at the forecasting stage, not at the reorder point.
5. Supply Chain Agility and Resilience
Companies that forecast well are faster to detect demand signals that indicate disruption whether from a new competitor, a festival spike, or a supply-side shock. This foresight enables proactive supply chain risk management rather than reactive fire-fighting.
6. Stronger Supplier and Partner Relationships
Sharing demand forecasts with suppliers and logistics partners creates the visibility they need to prepare capacity, allocate raw materials, and optimize transportation. This is the foundation of collaborative supply chain models like CPFR and VMI, which consistently outperform transactional procurement in cost and service outcomes.
Read More About: What Is Just-in-Time (JIT)?
Types of Demand Forecasting
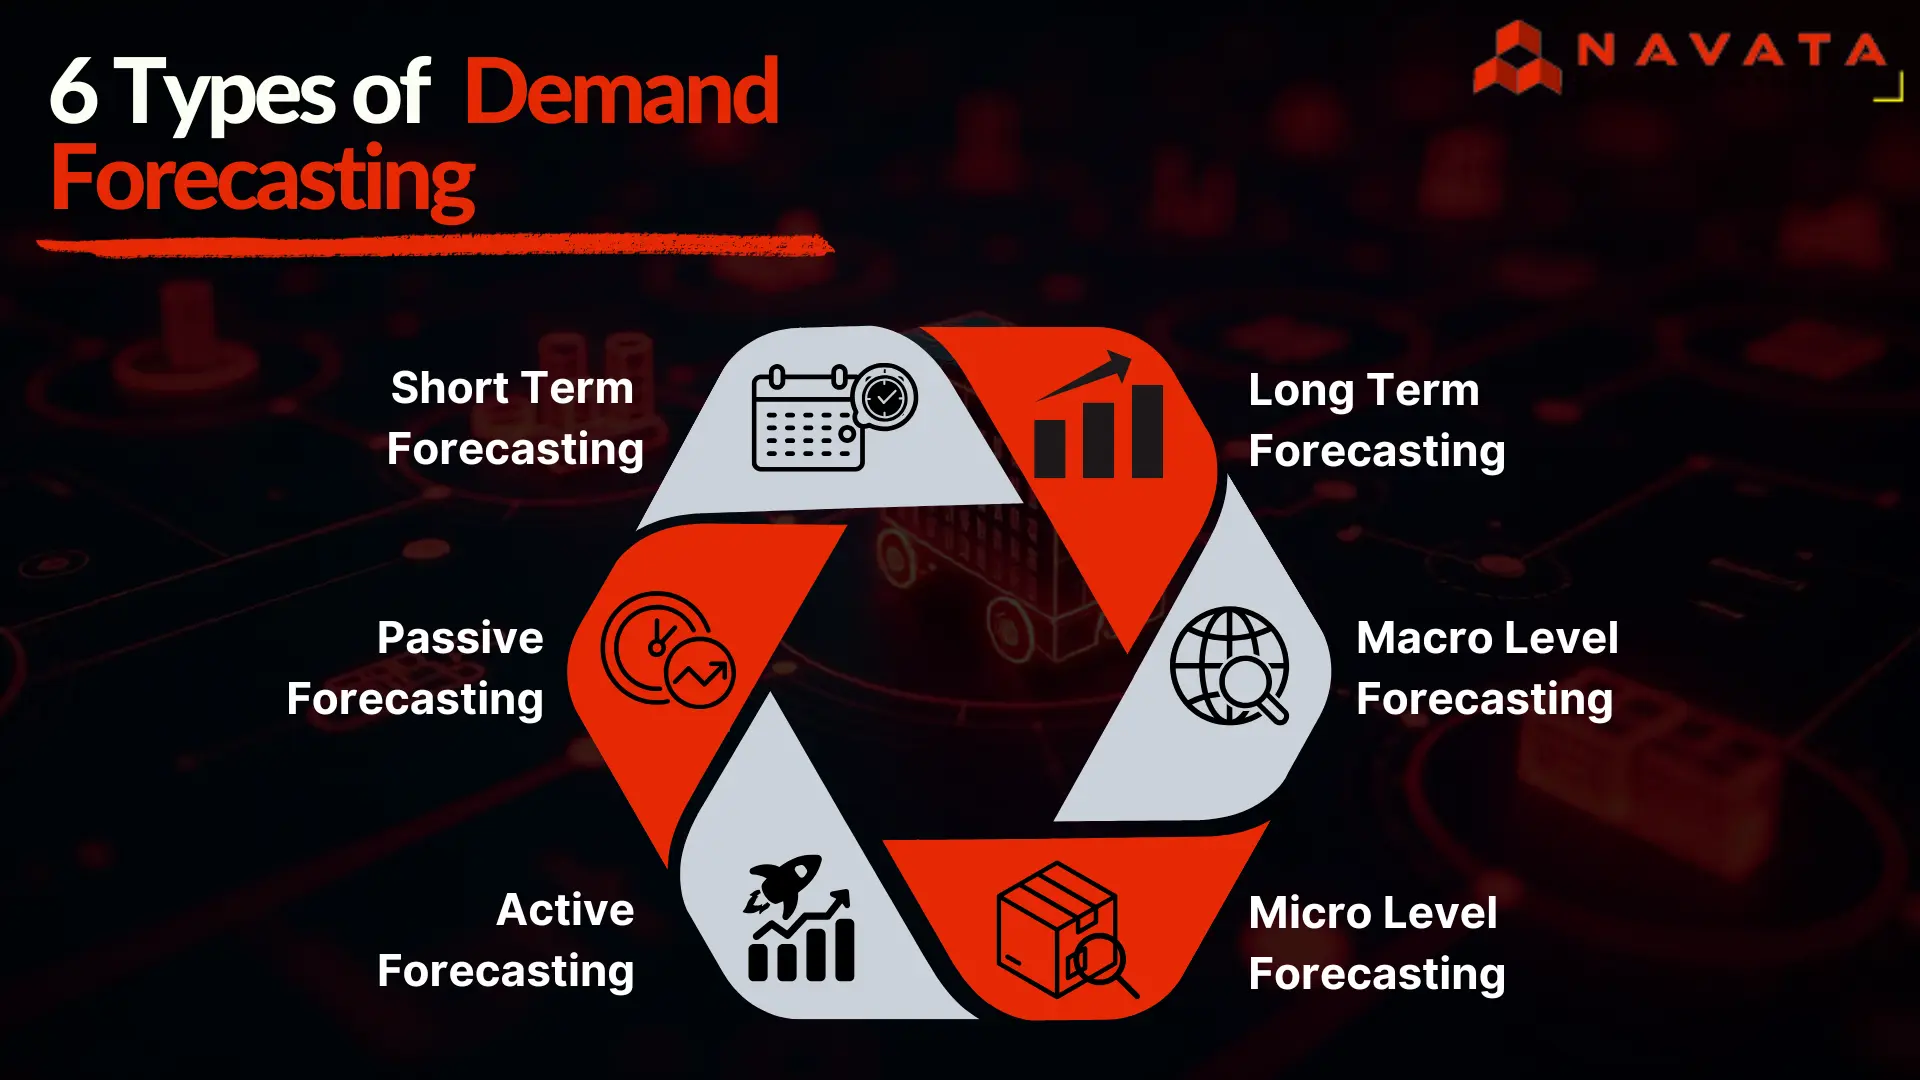
The six main types of demand forecasting are:
- Short-term forecasting:- covers a horizon of up to 12 months, used for inventory replenishment, staffing, and distribution planning
- Long-term forecasting:- spans 1 to 5+ years, used for capacity investment, product strategy, and network design
- Macro-level forecasting:- estimates demand at the industry, national, or global level, using economic indicators and market research
- Micro-level forecasting:- drills down to the product, SKU, or regional level, used for operational planning
- Active forecasting:- used by growth-stage businesses entering new markets or launching new products, where historical data is limited
- Passive forecasting:- used by stable businesses with consistent demand patterns, relying primarily on historical trend analysis
| Dimension | Short-term | Long-term |
|---|---|---|
| Time horizon | Under 12 months | 1–5+ years |
| Accuracy | High | Lower |
| Primary use | Inventory replenishment, staffing | Capacity planning, product strategy |
| Methods used | Moving average, exponential smoothing, AI | Delphi, econometric, scenario modelling |
| Update frequency | Weekly / Monthly | Quarterly / Annually |
| Key risk | Missing trend shifts | External disruptions hard to predict |
Many organizations operate across all six types simultaneously. An FMCG company might use short-term micro-level forecasting for weekly replenishment while running long-term macro-level analysis to support a new regional warehouse investment decision.
Demand Forecasting Methods: 7 Techniques Explained
The seven main demand forecasting methods span three categories qualitative, quantitative, and advanced AI/ML each suited to different data availability, business contexts, and accuracy requirements.
Qualitative Methods
Qualitative forecasting relies on expert judgment, market intelligence, and structured opinion-gathering. These methods are essential when historical data is sparse, unreliable, or absent such as during new product launches, market entry, or after major structural disruptions.
1. Delphi Method A structured process of iteratively surveying a panel of experts, aggregating responses anonymously, and feeding results back until consensus emerges. Best for long-horizon forecasting or forecasting in categories without usable historical precedent. Highly effective for new product introductions, infrastructure planning, and demand in emerging markets.
2. Market Research and Consumer Surveys Direct data collection from target customers about purchase intentions, preferences, and price sensitivity. Useful for demand forecasting ahead of product launches, in understanding seasonal preference shifts, or for segmented demand analysis by region or demographic.
3. Sales Force Composite Aggregates demand estimates from frontline sales representatives who have direct customer knowledge. Bottom-up in structure and rich in qualitative signals, though prone to systematic bias (sales teams tend to under-forecast to lower targets, or over-forecast to justify stock requests). Effective when combined with statistical correction for known biases.
4. Focus Groups Small-group qualitative research sessions that surface consumer sentiment, unmet needs, and demand drivers. More appropriate for product development and market sizing than for operational forecasting, but valuable as an input to long-range demand planning.
Quantitative Methods
Quantitative demand forecasting uses mathematical models applied to historical data. These methods are the backbone of operational forecasting for most supply chain functions.
5. Moving Average Calculates demand forecast as the average of the most recent N periods. Simple, transparent, and effective for stable, low-volatility demand patterns. A 3-month moving average of widget sales, for example, takes the average units sold over the past three months as the forecast for the coming month. Limitation: it lags trend changes and handles seasonality poorly without adjustment.
6. Exponential Smoothing Applies a weighted average where more recent observations carry greater weight than older ones. Single exponential smoothing is appropriate for demand without trend or seasonality. Holt’s double exponential smoothing extends this to trend-adjusted forecasting. Holt-Winters triple smoothing handles both trend and seasonality making it a strong all-purpose quantitative method for many FMCG and retail applications.
7. Regression Analysis Builds a statistical relationship between demand (the dependent variable) and one or more explanatory variables price, promotions, economic indicators, competitor activity, weather. Multiple regression is particularly powerful when demand is causally driven by identifiable, measurable factors. For example, a cold beverage manufacturer might model demand as a function of temperature, promotional spend, and household income in the target region.
Other important quantitative methods include naive forecasting (using last period’s actuals as the next period forecast, useful as a baseline benchmark), trend projection (extrapolating historical growth trajectories), and econometric modelling (multi-equation systems that account for market-wide interdependencies).
Advanced AI and Machine Learning Methods
AI-Powered Demand Forecasting Modern AI demand forecasting encompasses a range of techniques: ARIMA and SARIMA for time series with trend and seasonality, gradient boosting models (XGBoost, LightGBM) that handle non-linear relationships with high accuracy, neural networks for pattern recognition in complex datasets, and ensemble methods that combine multiple model outputs for robustness.
AI models process far more variables than traditional statistical methods, incorporating not just historical sales data but also web search trends, social media sentiment, weather data, economic indicators, competitor pricing signals, and point-of-sale data from retail partners.
| Method | Type | Data Required | Best For | Accuracy |
|---|---|---|---|---|
| Delphi Method | Qualitative | Expert opinions | New products, no historical data | Moderate |
| Market Research | Qualitative | Customer surveys | Market entry, NPL | Moderate |
| Moving Average | Quantitative | Historical sales (N periods) | Stable, low-volatility demand | Moderate |
| Exponential Smoothing | Quantitative | Time series | Short-term, seasonal demand | Moderate–High |
| Regression Analysis | Quantitative | Multi-variable data | Causal demand relationships | High |
| ARIMA / SARIMA | Quantitative / Statistical | Long time series | Trend + seasonal patterns | High |
| AI/ML Models | Advanced | Large, diverse datasets | Complex, volatile, multi-variable demand | Very High |
How to Build a Demand Forecasting Process: 5 Steps
Building a reliable demand forecasting process requires a structured, repeatable approach not a one-time model build. Here are the five foundational steps:
Step 1: Data Collection and Cleansing
Gather historical sales data, inventory records, point-of-sale data, and relevant external market signals (promotional calendars, economic indicators, seasonal indices). Data quality is the single most important determinant of forecast accuracy. Cleanse for outliers, missing values, and anomalies caused by one-time events (stockouts that suppressed demand, promotional spikes that distort baseline trends).
Step 2: Method and Model Selection
Choose the forecasting method best suited to your data availability, demand pattern type, industry context, and time horizon. A new product launch requires qualitative methods. A mature SKU with three years of clean weekly data may suit exponential smoothing or AI ensemble methods. Consider whether you need SKU-level granularity or category-level aggregation.
Step 3: Model Development and Calibration
Build and calibrate your forecasting model. For statistical models, this means fitting parameters to historical data and running backtests. For AI/ML models, this means feature engineering, training on historical datasets, and hyperparameter tuning. For qualitative methods, this means structuring the elicitation process and combining expert inputs through a consensus methodology.
Step 4: Forecast Validation
Test the model against a holdout dataset data the model has not seen and calculate accuracy metrics including MAPE, MAD, and forecast bias. Validate that the model is performing consistently across product categories, time horizons, and geographies. Do not deploy a model that hasn’t been validated against real business conditions.
Step 5: Continuous Monitoring and Revision
Demand forecasting is not a set-and-forget activity. Track forecast accuracy over time using your defined KPIs. Set alert thresholds if MAPE exceeds 15% in a category for two consecutive months, trigger a model review. Update models as market conditions change, new data arrives, and business context evolves. Integrate forecast performance reviews into the monthly S&OP cycle.
Demand Forecasting KPIs & Accuracy Metrics
Demand forecast accuracy is measured through a set of standardized statistical and operational KPIs. Understanding these metrics is essential for evaluating model performance, benchmarking against industry standards, and communicating forecast quality to business stakeholders.
MAPE:- Mean Absolute Percentage Error
MAPE is the most widely used forecast accuracy metric in supply chain management. It expresses forecast error as a percentage of actual demand, making it directly comparable across products with different volumes.
Formula: MAPE = (Σ |Actual − Forecast| / Actual) × 100 / n
A MAPE of 8% means the forecast was, on average, 8% away from actual demand across the measured periods. MAPE is intuitive and communicable to non-technical stakeholders, but can be misleading when actual demand values are close to zero (division by very small numbers inflates the metric).
MAD:- Mean Absolute Deviation
MAD measures the average absolute size of forecast errors in units, without expressing them as percentages. Useful for comparing error magnitude in absolute terms and for setting safety stock levels.
Formula: MAD = Σ |Actual − Forecast| / n
RMSE:- Root Mean Square Error
RMSE penalizes large errors more heavily than small ones because errors are squared before averaging. This makes it particularly useful for identifying and penalizing models that produce occasional very large misses which are often more damaging operationally than consistent moderate errors.
Formula: RMSE = √(Σ(Actual − Forecast)² / n)
Forecast Bias
Forecast bias measures the systematic tendency of a model to over-forecast or under-forecast. A persistently positive bias (forecasts consistently exceed actuals) drives overstock; a persistently negative bias drives stockouts. Identifying and correcting bias is often more operationally urgent than reducing absolute error.
Formula: Bias = Σ(Forecast − Actual) / Σ Actual × 100
| Metric | Formula | Excellent | Acceptable | Poor |
|---|---|---|---|---|
| MAPE | (Σ|A−F|/A) × 100 / n | < 10% | 10–20% | > 20% |
| MAD | Σ|A−F| / n | Industry-specific | Industry-specific | Depends on volume |
| RMSE | √(Σ(A−F)² / n) | Lower is better | — | Depends on context |
| Forecast Bias | Σ(F−A)/ΣA × 100 | Near 0% | ±5% | > ±10% |
| Fill Rate | Orders filled / Total orders × 100 | > 98% | 95–98% | < 95% |
| Stockout Rate | Stockout events / Total SKUs × 100 | < 2% | 2–5% | > 5% |
These metrics are most powerful when tracked together a model with excellent MAPE but persistent negative bias will still cause chronic stockouts. A comprehensive forecast accuracy dashboard monitors all six dimensions simultaneously.
AI and Machine Learning in Demand Forecasting 2026
AI improves demand forecasting by processing hundreds of variables simultaneously, including real-time sales data, weather patterns, social media signals, and economic indicators, to generate granular, SKU-level predictions that continuously self-improve as new data arrives. According to Capgemini Research, AI-powered forecasting reduced excess inventory by 15–20% and stockouts by 12–18% for 74% of retailers studied. A separate IBM Institute for Business Value report found that 64% of Chief Supply Chain Officers are already deploying or piloting generative AI in supply chain planning as of 2025.
What AI Does Differently
Traditional statistical forecasting models use internal historical data and a limited number of explanatory variables. They are built once, validated once, and updated manually typically quarterly or annually. AI and machine learning forecasting systems are fundamentally different in three ways:
Scale of inputs: AI models can ingest hundreds of signals in parallel POS data, website traffic, search trends, social media sentiment, macroeconomic indicators, weather forecasts, competitor pricing, and supply-side signals all simultaneously.
Granularity: Where traditional models forecast at the product-category level, AI forecasting operates at the SKU-location level, enabling individual store or warehouse-level predictions that are far more operationally actionable.
Continuous learning: Machine learning models update as new data arrives, recalibrating their parameters without human intervention. This means forecast accuracy improves over time rather than degrading between manual update cycles.
Demand Sensing: The Real-Time Frontier
Demand sensing is a specific application of AI forecasting that focuses on the ultra-short horizon, typically 1 to 14 days. By consuming real-time signals such as point-of-sale data updated hourly, social media activity, weather forecasts, and local event calendars, demand sensing dynamically adjusts near-term replenishment signals to reflect what is actually happening in the market right now not what happened last quarter.
Demand sensing is transforming replenishment in fast-moving consumer goods and quick-commerce logistics in India, where a weather event or trending social media post can shift local demand for certain categories by 30–50% within 48 hours.
Generative AI in Demand Forecasting
The frontier in 2026 is the integration of generative AI with demand forecasting workflows. GenAI is being applied to synthesize unstructured data news feeds, earnings call transcripts, social media conversations, and supplier communications into structured demand signals that traditional statistical models cannot access. Early adopters are using GenAI to automatically generate scenario-based demand plans: “What does our demand forecast look like if the monsoon arrives three weeks early in Maharashtra?” or “How should we adjust our festival-season plan if a major competitor announces a flash sale?”
| Dimension | Traditional Forecasting | AI / ML-Powered Forecasting |
|---|---|---|
| Data sources | Internal sales data | Internal + external (weather, social, economic) |
| Variables processed | 5–10 | Hundreds |
| Update frequency | Monthly / Quarterly | Real-time / Continuous |
| Forecast granularity | Product category | SKU-location level |
| Forecast horizon | Static | Dynamic, rolling |
| Error reduction vs baseline | Baseline | Up to 50% improvement (Capgemini) |
| Skill required | Excel, statistics | Data science, ML platforms |
Demand Forecasting in India: Logistics, 3PL & E-commerce
India is the most complex and arguably the most exciting demand forecasting environment in the world. No global competitor, Salesforce, IBM, or NetSuite, has operationalised demand forecasting within India’s logistics infrastructure. This section covers what makes demand forecasting in India unique and how companies like Navata SCS apply it across 3PL, warehousing, transportation, and e-commerce operations.
Demand Forecasting for Logistics and Transportation in India
India’s logistics sector is projected to reach $380 billion by 2025 (IBEF), growing at a CAGR of approximately 10.5%. The country’s ranking on the World Bank Logistics Performance Index improved from 44th to 38th between 2018 and 2023 a trajectory that will accelerate further as PM Gati Shakti infrastructure investments mature.
For logistics and transportation operators, demand forecasting operates at the lane level: predicting freight volumes on specific origin-destination corridors, by load type, by time of year. India’s demand patterns are shaped by factors that global forecasting models are not built to handle:
- Festival seasonality: Diwali, Dussehra, Navratri, Eid, harvest festivals, and wedding seasons drive dramatic short-term demand spikes that vary significantly by region. A South India-focused 3PL will see materially different seasonal demand curves from a North India or West India operator.
- Agricultural cycles: Harvest patterns in key producing states drive freight demand for food grains, perishables, and agricultural inputs that are highly predictable but require India-specific seasonal models.
- Infrastructure changes: The operationalisation of Dedicated Freight Corridors, the expansion of Grade-A warehousing in Tier-2 cities, and PM Gati Shakti multimodal connectivity are creating new logistics demand patterns that historical data alone cannot capture.
- GST-era network restructuring: Post-GST supply chain realignment consolidated warehousing from 30+ state-based tax warehouses to optimized national distribution networks. Companies still recalibrating their networks need forecasting models that account for these structural shifts in inventory positioning.
At Navata SCS, demand forecasting is applied across our transportation network to predict lane utilization, optimize fleet deployment, and reduce empty-vehicle kilometres — translating directly into lower freight cost per tonne-kilometre for our clients.
Demand Forecasting for Warehousing in India
India’s warehousing market is expected to reach INR 2,243 billion by 2026 at a CAGR of 10.9% (JLL India). The boom in Grade-A warehousing large-format, modern, multi-client facilities concentrated around Mumbai, Delhi NCR, Bengaluru, Hyderabad, Pune, and Chennai is fundamentally changing how demand forecasting integrates with warehouse management.
For warehouse operators and 3PL companies, demand forecasting drives:
- Capacity planning: How much space to commit to which clients in which quarters, based on forecasted inbound and outbound volumes
- Labour planning: How many workers to deploy by shift, season, and activity type
- Slotting optimization: Where to position fast-moving SKUs within the warehouse to minimize pick travel time, based on forecasted velocity rankings
- Seasonal flex strategies: Pre-positioning inventory 4–6 weeks before demand peaks to avoid the last-minute scramble that drives up drayage costs and creates congestion
A leading FMCG company using Navata SCS’s 3PL network across South India applies AI-driven demand forecasting to predict seasonal spikes during harvest festivals, optimizing warehouse inventory levels 4–6 weeks in advance and reducing overstock by approximately 15%.
Demand Forecasting for E-commerce in India
India’s e-commerce sector is a demand forecasting laboratory unlike any other. The coexistence of scheduled delivery models (Amazon, Flipkart), quick-commerce models (Blinkit, Zepto, Swiggy Instamart), and social commerce is creating demand patterns that change hourly not weekly.
Key demand forecasting challenges and opportunities in Indian e-commerce include:
Quick-commerce: The 10–30-minute delivery promise requires demand forecasting at the dark store level, with rolling 2–4-hour forecast windows informed by real-time demand sensing. Weather events, cricket matches, and trending content can shift demand for specific SKUs by 50–100% within a single afternoon.
ONDC (Open Network for Digital Commerce): India’s government-backed open commerce protocol is democratizing e-commerce access, enabling small retailers and regional brands to participate in the digital commerce ecosystem. As ONDC scales, it will generate new demand data streams that forward-looking forecasting systems can leverage for more granular regional demand visibility.
Major sale events: Amazon Great Indian Festival, Flipkart Big Billion Days, and Myntra End of Reason Sale compress months of demand into 4–7 days. Effective demand forecasting for these events requires purpose-built event-overlay models that supplement baseline statistical forecasting.
Demand Forecasting for Retail and Manufacturing in India
India’s organized retail sector, led by DMart, Reliance Retail, Tata-owned chains, and regional grocery networks, uses category-level demand forecasting to manage replenishment across hundreds of stores. The complexity here lies in India’s extraordinary regional demand variation: a product category dominant in Tamil Nadu may be niche in Rajasthan. Effective retail demand forecasting requires regional model disaggregation, not a single national model.
On the manufacturing side, three structural shifts are creating new demand forecasting imperatives: the Make in India initiative driving domestic manufacturing growth; India’s rise as the world’s third-largest automobile market, creating complex automotive supply chain forecasting requirements; and the China+1 strategy, as global manufacturers diversify production into India, creating net-new demand streams that have no historical precedent.
India’s pharmaceutical sector, which produces over 50% of global vaccine supply and is the world’s largest generic drug exporter, has demanding cold chain forecasting requirements driven by export volumes, domestic public health programme demand, and highly seasonal illness patterns that require statistical models calibrated to Indian epidemiology.
S&OP and CPFR: Integrating Demand Forecasting with Business Strategy
Demand forecasting does not operate in isolation; it is the input that drives Sales and Operations Planning (S&OP), the monthly cross-functional process that aligns sales, marketing, finance, production, and supply chain on a single unified demand-supply plan.
S&OP and Demand Forecasting
In the S&OP cycle, the statistical demand forecast generated by the planning team is reviewed and refined by commercial teams who layer in promotional plans, new product launches, pricing changes, and market intelligence. The result is a consensus demand plan, a single agreed number by product and period that becomes the operating baseline for inventory, production, procurement, and finance.
An effective S&OP process transforms demand forecasting from a technical exercise performed by planners into a company-wide commitment that aligns strategy with execution. The key steps in the S&OP cycle include: statistical forecast generation, commercial review and adjustment, supply review (capacity, procurement, lead times), pre-S&OP reconciliation, and executive S&OP sign-off.
Supply chain visibility is the enabling condition for an effective S&OP you cannot plan what you cannot see.
CPFR: Collaborative Planning, Forecasting, and Replenishment
CPFR extends demand forecasting beyond the four walls of a single company to include trading partners, suppliers, retailers, and logistics providers. In a CPFR arrangement, buyer and seller share demand forecasts, promotional calendars, and inventory data in a structured, ongoing collaboration. The result is a jointly managed demand plan that reduces the bullwhip effect, the amplification of demand variability as signals travel upstream through the supply chain.
For India’s growing organized retail and FMCG sectors, CPFR between manufacturers and modern trade retailers offers a significant competitive advantage: lower inventory levels at both ends of the trading relationship, higher in-stock rates, and lower collaborative supply chain costs.
Demand Forecasting Challenges and Best Practices
The 5 Main Challenges in Demand Forecasting
1. Over-Reliance on Historical Data Historical data is a necessary foundation but an insufficient basis for forward-looking forecasting. Markets change, consumer behaviour evolves, and disruptions pandemics, geopolitical events, new market entrants create structural breaks in historical demand patterns. Models that look backward without incorporating forward signals will consistently miss turning points.
2. Failure to Account for Seasonality and Causal Factors Many businesses use simple trend extrapolation that ignores seasonal cycles, promotional impacts, and causal relationships. In India, where festival seasonality drives some categories to 3–5x baseline demand in a 2–4 week window, seasonal model blind spots translate directly into stockouts at exactly the time when customer expectations and competitive pressure are highest.
3. Silos Between Sales, Marketing, and Supply Chain Demand forecasting is most accurate when commercial intelligence (promotional plans, new product launches, pricing changes, competitive intelligence) is systematically incorporated into the statistical baseline. In organizations where sales and supply chain operate in separate silos, forecasting teams are building plans without access to information that frontline commercial teams hold.
4. Static Forecasting Without Continuous Monitoring A forecast built in Q1 and not revisited until Q2 will have accumulated significant error by the time it informs a procurement decision. Demand conditions change particularly in fast-moving categories, quick-commerce channels, and seasonally volatile markets. Effective demand forecasting requires rolling forecast updates and real-time monitoring against predefined accuracy thresholds.
5. Data Quality and Completeness Issues Garbage in, garbage out. Demand forecasting is only as good as the underlying data. Common data quality issues include missing periods (caused by stockouts that suppress actual demand), promotional noise in the baseline (large promo events inflating apparent trend), system migrations that break historical continuity, and SKU proliferation that thins the data available for each individual item.
5 Demand Forecasting Best Practices
1. Use a Hierarchical Forecasting Approach Forecast at multiple levels — national, regional, category, and SKU and reconcile top-down and bottom-up estimates. This produces more stable aggregate forecasts while retaining SKU-level granularity for operational decisions.
2. Build Collaborative Forecasting Processes Create structured forums for commercial teams (sales, marketing, trade promotion) to review and adjust statistical forecasts before they enter the S&OP cycle. The combination of statistical baseline and market intelligence consistently outperforms either alone.
3. Track and Act on Forecast Bias MAPE tells you how accurate your forecast is. Bias tells you whether you are systematically wrong in one direction. Identifying and correcting systematic bias — which often has organizational roots (sales teams over-forecasting to justify stock levels, for example) typically delivers more operational value than improving raw accuracy.
4. Invest in Data Infrastructure Before Models Forecasting model sophistication is limited by data quality. Before deploying advanced AI forecasting, invest in clean, consistent, granular data pipelines. A well-calibrated exponential smoothing model on clean data will outperform a neural network trained on inconsistent data.
5. Test and Learn Continuously Treat demand forecasting as an ongoing scientific process, not a one-time implementation. Run controlled experiments comparing forecasting methods. Measure results against defined KPIs. Iterate. The best demand forecasting organizations in India and globally are those that have built a culture of continuous improvement around forecast accuracy, not those that invested the most in technology.
Demand Forecasting Tools & Software
The demand forecasting software market ranges from enterprise-grade integrated planning suites to standalone statistical tools and AI-native platforms. The right choice depends on your company’s size, data maturity, existing ERP landscape, and operational complexity.
SAP Integrated Business Planning (SAP IBP): The market-leading enterprise demand planning and S&OP platform, tightly integrated with SAP ERP. Best suited for large enterprises with significant SAP investment. Offers advanced statistical forecasting, AI-assisted sensing, and collaborative planning workflows.
Oracle Fusion SCM / Oracle NetSuite: Oracle’s supply chain planning suite offers strong demand management capabilities integrated with Oracle ERP. NetSuite’s demand planning module is well-suited for mid-market companies.
Blue Yonder (formerly JDA): A specialist supply chain planning platform with strong demand forecasting, replenishment, and S&OP capabilities. Widely used in retail, FMCG, and 3PL sectors globally.
Kinaxis RapidResponse: Known for speed and scenario planning capability. Well-suited for volatile, complex supply chains where rapid replanning and “what-if” analysis are critical requirements.
o9 Solutions: A newer, AI-native integrated business planning platform growing rapidly in market share. Strong in connected planning across demand, supply, and finance.
Logility: A mid-market specialist in demand and inventory planning, with a strong track record in consumer goods and retail.
Microsoft Dynamics 365 Supply Chain: An increasingly capable demand forecasting module within the Microsoft ERP ecosystem, with AI forecasting powered by Azure Machine Learning. Well-suited for companies already on the Microsoft platform.
Many 3PL and logistics companies in India including Navata SCS deploy ERP-integrated forecasting modules combined with custom analytical layers that incorporate India-specific demand signals. The right platform for your business depends on your data maturity, ERP landscape, and budget. Talk to our supply chain experts to understand how we support demand forecasting across our client base in India.
Conclusion
Demand forecasting is the strategic foundation of every high-performing supply chain. From reducing excess inventory and preventing stockouts to enabling precise production planning and building resilient logistics networks, the ability to predict what customers will need and when is what separates reactive supply chains from proactive ones.
For businesses operating in India, demand forecasting carries unique imperatives: festival seasonality, regional demand variation, the explosive growth of e-commerce and quick-commerce, and the infrastructure transformation underway through PM Gati Shakti. No global vendor can replicate the operational knowledge that comes from running warehouses, transportation networks, and 3PL operations across India’s diverse markets.
Navata SCS is an operating supply chain company not a software vendor. We apply demand forecasting in our day-to-day 3PL, warehousing, and transportation operations to deliver better outcomes for our clients. If you are looking for a supply chain partner who understands both the science of forecasting and the operational realities of Indian logistics, talk to our supply chain experts →.
Thanks For Reading: What Is Demand Forecasting? The 2026 Guide to Methods, Types & KPIs
Powered By 360Presence
Q1: What is demand forecasting?
Demand forecasting is the analytical process of estimating future customer demand for products or services using historical sales data, market trends, and statistical or AI-powered models. It enables businesses to optimize inventory levels, align production schedules, reduce costs, and improve customer satisfaction across the entire supply chain.
Q2: What is the difference between demand forecasting and demand planning?
Demand forecasting predicts future customer demand using data and statistical models, answering “how much will be needed?” Demand planning converts those predictions into actionable supply chain strategies covering procurement, production, and inventory decisions. Forecasting provides the intelligence; planning provides the execution roadmap. Both must work together for effective supply chain management.
Q3: What are the main types of demand forecasting?
The six main types of demand forecasting are: short-term forecasting (under 12 months), long-term forecasting (1–5+ years), macro-level forecasting (economy-wide factors), micro-level forecasting (product or regional specificity), active forecasting (growth-phase businesses), and passive forecasting (stable businesses using historical data).
Q4: What are the most common demand forecasting methods?
The most widely used demand forecasting methods include qualitative methods such as Delphi and consumer surveys, quantitative methods such as moving averages, exponential smoothing, and regression analysis, and advanced AI/ML methods such as time series neural networks and gradient boosting models. Most organizations use a combination of methods calibrated to their data availability and operational context.
Q5: How do you measure demand forecasting accuracy?
Demand forecasting accuracy is typically measured using MAPE (Mean Absolute Percentage Error), MAD (Mean Absolute Deviation), and RMSE (Root Mean Square Error). MAPE is the most widely used: a MAPE below 10% is considered excellent, 10–20% is acceptable, and above 20% indicates the model needs significant improvement. Forecast bias should be tracked alongside MAPE to detect systematic over- or under-forecasting.
Q6: How does AI improve demand forecasting?
AI improves demand forecasting by processing hundreds of variables simultaneously — including real-time sales data, weather patterns, social media signals, and economic indicators — to generate granular, SKU-level predictions. Machine learning models continuously self-improve as new data arrives. According to Capgemini Research, AI forecasting reduced excess inventory by 15–20% and stockouts by 12–18% for 74% of retailers studied.
Q7: What is demand sensing in the supply chain?
Demand sensing is a real-time demand forecasting technique that uses short-horizon signals — including point-of-sale data, social media activity, weather data, and web search trends — to dynamically adjust near-term forecasts (typically 1–14 days out). It bridges the gap between traditional statistical forecasting and actual market conditions, significantly reducing forecast error in fast-moving supply chains.
Q8: What is MAPE in demand forecasting?
MAPE, or Mean Absolute Percentage Error, is the most common metric for measuring demand forecast accuracy. It calculates the average percentage difference between forecasted and actual demand values. Formula: MAPE = (|Actual − Forecast| / Actual) × 100, averaged across all periods. A MAPE under 10% is generally considered excellent for most supply chain applications.
Q9: What are the biggest challenges in demand forecasting?
The five biggest challenges in demand forecasting are: over-reliance on historical data, failure to account for seasonality and causal factors, lack of cross-functional collaboration between sales and operations, maintaining static forecasts without continuous monitoring, and data quality and completeness issues. Addressing these systematically — not just investing in better forecasting software — drives the most meaningful improvement in forecast accuracy.
Q10: What demand forecasting software is commonly used?
Leading demand forecasting software platforms include SAP Integrated Business Planning (SAP IBP), Oracle Fusion SCM, Blue Yonder, Kinaxis RapidResponse, o9 Solutions, and Logility. Many 3PL and logistics companies in India also deploy ERP-integrated forecasting modules combined with custom analytical layers. The best platform depends on company size, data maturity, and supply chain complexity.


3 Comments
Comments are closed.